Lidar Scanner Project
Created using a MSP432E401Y board and a VL53L1X TOF Sensor
General Description:
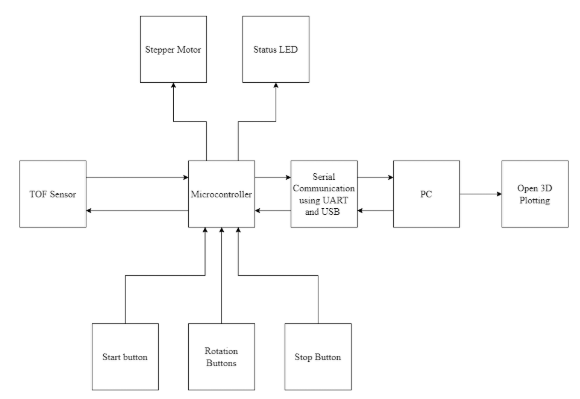
The purpose of the device is to collect data on its surrounding environment by taking several distance measurements using a TOF sensor. The TOF sensor works by sending a light signal and measuring the time required to travel back to the sensor and calculates the distance using the speed of light. This sensor is mounted on a motor that spins 360 degrees, and can be controlled by several buttons. The device takes 32 scans every 360 degrees and outputs them using UART. Each 360 degree spin is triggered by an input button on the microcontroller. The motor starting position can also be adjusted using two rotation buttons for the user. An extra button is used to stop serial communication The PC uses the serial library in python to open the port. This data is processed by removing the arbitrary numbers and storing the distance. The distance is then used to calculate y and z values, and an x value is added for the loop #. This is then printed into a .xyz file which is used to create a point cloud.
Features and Specs:
- MSP432E401Y Microcontroller with the Arm Cortex-M4F
- Distance Measurements from VL53L1X TOF Sensor
- 28BYJ-48 Stepper Motor
- ULN2003 Motor Controller
- Buttons to control rotation and stop serial communication
- Status LED
- Serial communication with PC using pySerial
- Environment Plotting
- 3.3V Operating Voltage
- 256kB of SRAM
- 1MB of flash
- 12-bit SAR ADC
- C++ Microcontroller code, Python PC code
- Baud rate: 115.2k
- Bus speed: 12Mhz
Distance Measurements:
The TOF sensor has an emitter and sensor. The emitter sends a light signal from the emitter, which will then bounce off a target and be received by the emitter. Using the following equations:
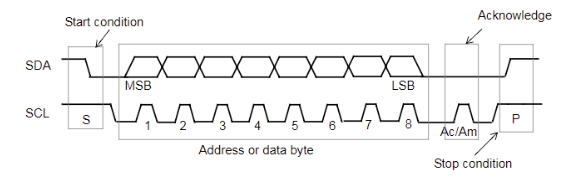
Using the distance equation, substituting in the speed of light (3x10⁸ m/s) for v and using the time measured will give us twice the distance since the signal has to go to the target and back. Therefore this value is divided by 2 to give us a distance measurement. This distance measurement is then transmitted to the microcontroller using the I2C protocol. The TOF sensor has the following 4 connections to the microcontroller:
- SDA (I2C data line)
- SCL (I2C clock line)
- SCL (I2C clock line)
- Vin
- Gnd
The microcontroller pins used are the 3.3V, GND, PB2 and PB3 pins. The Vin and 3.3v are connected, grounds are connected, SCL is connected to PB3 and SDA is connected to PB3. The sensor transmits the data of the distance through the SDA line in 8 bit packets Once the data is acquired by the microcontroller, it is then transmitted to the connected PC through UART protocol using serial communication through COM 3 of the laptop. The code provided opens the serial port COM3 with a baud rate of 115.2k. The code provided also reads the UART output as a string and is stored in a variable, in this case x.
The result is an array that stores the different numbers printed in separate indexes. The distance measurement is stored in the first index. This is indexed, and multiplied by the sin or cos of the angle of the scan to find the y, z coordinates respectively. The angle is tracked by a counter variable that increments every time the scan is complete and multiplies the incrementing variable by 11.25 since there are 32 scans and each scan will occur once the motor spins 11.25 degrees beyond its current position. This is then printed into a .xyz file in the following format: [ X Y Z, X2 Y2 Z2, Xn Yn Zn] Where X is an arbitrary value that is incremented (in this program the increment is 400) every loop as this represents the displacement of the device. The Y and Z are calculated using distance as explained above.
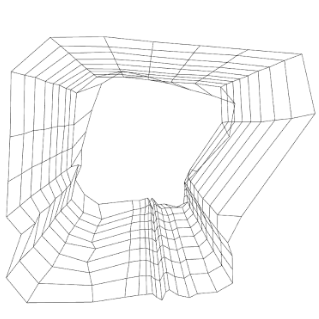
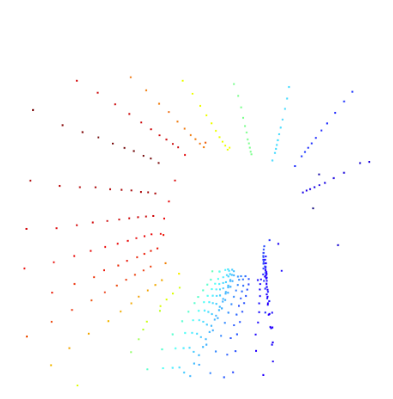
Visualization
Data is transmitted using UART and processed using a split function, which extracts the distance measurement. This measurement is only sorted if the UART entry has a 0, 1 or 2 in the entry which none of the initially transmitted lines for setup have. The second result in the printed serial input is taken, and calculates the coordinates using cos and sin with a constant number based on how many scans are taken per rotation and a counting variable that increments the degree based on the degree of the motor. Then an X value is attached to each spin to represent each plane. This number is then printed into a .xyz file for visualization. The visualization is done using open3d, which takes the x, y and z coordinates in the xyz file and creates a cloud of data points. Then the data points are connected using lines which are appended using a library function.
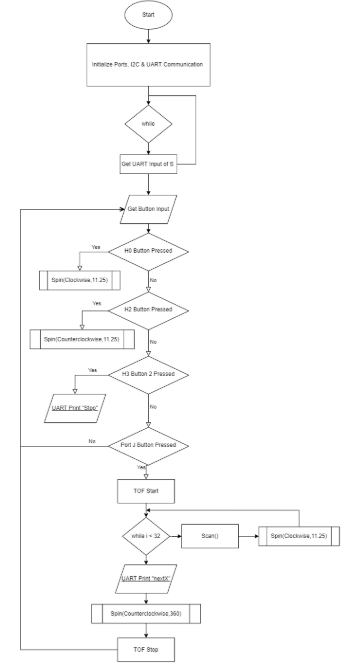
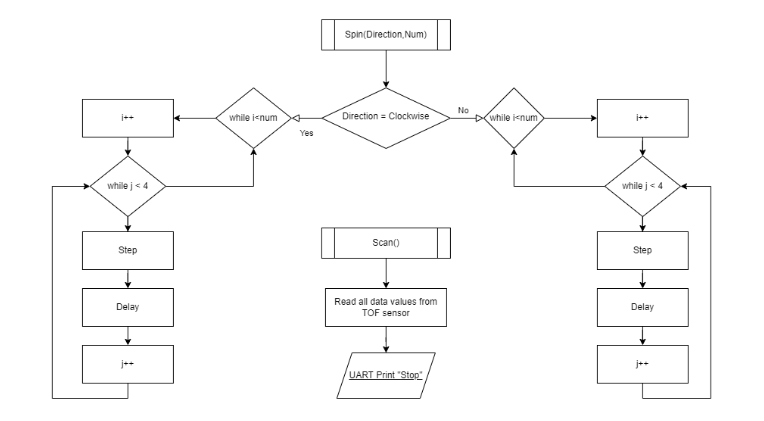
Programming Logic Flowchart(s)